
Facilitating Work Process Diagrams: Start with a Checklist

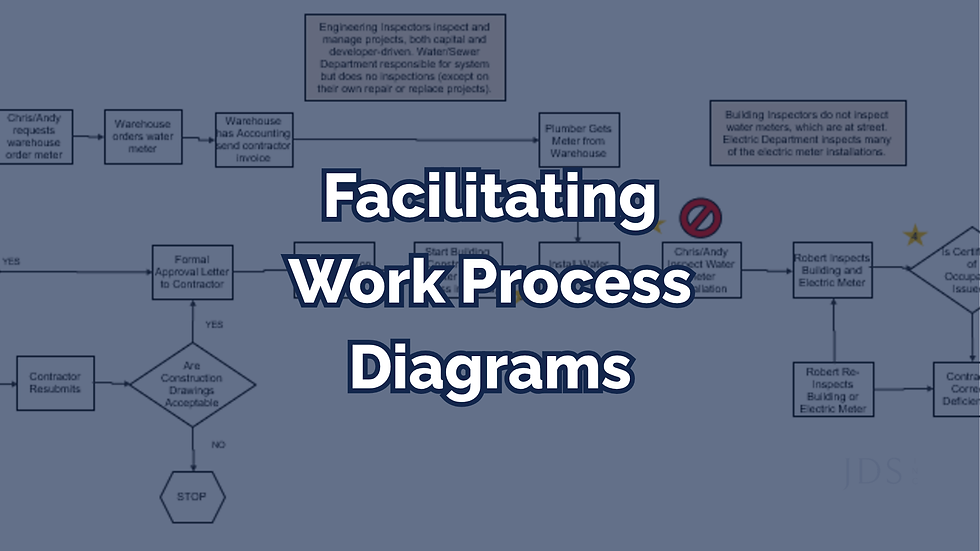
A work process diagram shows how work actually gets done. It includes the sequence of steps, the people involved, the decision points, and the handoffs between them. Accurately mapping work processes is where reliability, quality, and safety start on the front end. On the back end, it is how we understand what failed and how it failed.
The Problem and Solution
Ask five people how a process works and you will get five answers. Most facilitators pick one, usually the official procedure, and start drawing. The diagram looks clean, but the most important information never makes it onto the whiteboard.
The fix is simple. Have everyone write their own checklist before anyone touches the whiteboard. The differences between the checklists are the evidence.
Whether You Are a Specialist or Not
This is written for mid- and senior-level technical professionals who are not experts in developing work process diagrams.
Yes, some specialists do this full-time, and international standards exist for it. However, most of us are only asked to develop a work process diagram for a root cause analysis, an asset management workshop, or to help install new business software.
From the Real World
“So who was supposed to order the water meter for the site developer?” I asked.
“Our warehouse always does that,” said the town engineer. “We are fanatical about quality since we have to own and maintain it. And we always keep a few of the larger ones in stock.”
“Not anymore,” the assistant project manager rebutted. “The warehouse implemented a new policy about a year ago. Sometimes we do it, and sometimes the contractor does it.”
“That’s new to me,” replied the town engineer. “No one asked us about that change.”
The assistant project manager was disturbed by the confrontation. “Well, sometimes we supply it and sometimes the contractor does. You’ll have to ask the warehouse manager about that.”
“I wish we could, but I was told he didn’t need to be here,” I calmly stated. “Nevertheless, this root cause analysis feels like it’s turning on who ordered the wrong meter and why it was installed. I’ll see if I can get the warehouse manager over here now. Meanwhile, let’s have everyone write down their version of a checklist for getting a meter to the site once the site permit has been obtained.”
“Whose version are you going to use?” asked the town engineer. “Mine is the official one, but apparently they are not using it.”
“I am going to take everyone’s current version, and we’ll develop a work process diagram together on the whiteboard,” I replied. “Let’s see how we all see it individually first.”
Processes, Procedures, and Checklists
A process is the big picture of what happens, in what order, and who hands off to whom, while a procedure describes how one task inside it is performed. A checklist is only a memory aid that lists the steps without the decisions or handoffs. That limitation is exactly what makes a checklist useful in a root cause analysis.
Key Pieces of a Work Process Diagram
Formal standards include dozens of symbols. A root cause analysis needs only a few.
Activity nodes are boxes that represent one piece of work, written as a verb and an object: “Order meter,” “Install meter.” Each box needs an owner. If participants cannot agree on who owns a box, you have already found something worth investigating.
Decision diamonds mark points where the work can go more than one way. Listen for “sometimes” and “it depends.” Those terms usually signal a decision that has never been drawn.
Action arrows show what triggers the next step. A step can be done perfectly and still fail the process if the next person never learns it is done.
And and Or relationships separate steps that must all happen from steps that are alternatives. The meter is supplied by the warehouse OR the contractor. When that OR is not defined, each party can assume the other has it covered.
Done too formally or too soon, this notation overwhelms participants. The discussion drifts from what happened to how to draw it.
Where Facilitation Sessions Go Wrong
Most sessions go wrong in one of two ways. The first is anchoring. Putting the official procedure on the screen, or letting the most senior voice set the sequence, tells everyone how the work is supposed to happen. People defend it or quietly go along with it. The informal steps stay hidden.
The second is mapping the ideal. A root cause analysis is about a specific event. A beautiful diagram of how the process should work explains nothing about why the wrong meter was installed.
Why Starting with a Checklist Works
Everyone knows how to write a checklist. A participant who would never walk up to a whiteboard and draw a decision diamond will happily write ten lines on a notepad.
More importantly, checklists capture each person’s view independently. Experienced facilitators will recognize the principle from silent brainstorming and the nominal group technique: generate individually, then combine. Most process mapping guidance treats disagreement as noise to resolve so the map can be finished. In a root cause analysis, the disagreement is what you are looking for.
Five Ways to Build the Diagram from the Checklists
1. Make the checklist a requirement.
Give participants ten to fifteen minutes. Ask them to write the steps as they actually do them today and to note who does each checklist. Remember, it’s what gets done today and not what the official document says.
2. Draw the agreement first.
Post the checklists side by side. The steps everyone shares become the backbone of the diagram. This builds momentum and shows the group they share more than they think.
3. Mark the disagreements instead of voting on them.
Use a different color or a question mark. These marks are where causal factors tend to hide.
4. Turn every “sometimes” into a decision diamond with an owner.
Ask what the decision is based on and who makes it. If nobody can answer, write that down too.
5. Walk the actual event through the diagram.
Trace the specific case step by step. Note where the event followed the intended path and where it left it—the gap between the two feeds directly into the causal factor timeline.
Back to the Meter
Put side by side, the checklists did not agree on who ordered the meter. The official version said, “the warehouse.” The working version said, “it depends.”
When the warehouse manager arrived, he largely agreed with the assistant project manager. However, he had no formal decision process for when the warehouse ordered enough meters and when he let the contractor supply them. It was handled case by case. That haphazard decision point turned out to be a primary cause.
The solution was to get everyone back together and tighten a warehouse work process that had drifted without anyone noticing.
Evidence Before Argument or Agreement
Work process diagrams put individual accounts ahead of the official version and the loudest voice. The facilitator’s job is to get the evidence on the table before the argument starts. Start with the checklist. Have everyone write their own version first. Then refine together into a work process diagram on the whiteboard.
This piece is the third of four on tools I rely on in FAST root cause analysis. The first was Facilitating Reliability Block Diagrams: Follow the Drop. The second was Facilitating Causal Factor Timelines: Bring the Texts and Emails. For an overview of the FAST approach, see How to Get Amazing Root Cause Analysis (RCA) Results FAST.
D Solomon is the founder of JD Solomon, Inc., the creator of the FINESSE Fishbone Diagram®, and the co-creator of the SOAP criticality method©. He is the author of Communicating Reliability, Risk & Resiliency to Decision Makers: How to Get Your Boss’s Boss to Understand and Facilitating with FINESSE: A Guide to Successful Business Solutions.



Comments