Plus–Delta provides a balanced approach to understanding what should be repeated and what should be adjusted.
Technical teams depend on effective facilitation to make decisions and solve problems, but many sessions end without clear reflection or improvement. The Plus–Delta Feedback Method (Plus-Delta) provides a balanced approach to understanding what should be repeated and what should be adjusted. This article outlines how the technique enhances alignment and strengthens decision quality.
From the Real World
We had just completed our third session with the executive team related to a pre-session survey for the board of directors. Normally this is an “icebreaker” survey that’s based on many similar ones I have done with other boards before. But not with this team – every word was examined and it felt like every question was re-constructed. As the lead facilitator, I was more than a little tired and a little frustrated.
“JD, one more thing. What type of post-session evaluation survey are we going to use?” asked the General Manager.
I thought ‘oh shit’ but kept my composure, and stated, “I have this cool exercise thing I do at the end that everybody loves. Let’s roll with that.”
He looked skeptical but agreed.
A few weeks later, the workshop was a success. We knew that because Plus-Delta (and the participants) told us that. Better yet, the method was interactive, meaning both the General Manager and Chairman of the Board could hear what everyone thought.
“That was a great debrief exercise,” the general manager told me as he slapped me on the back. “I think I am going to use a version of that in everything I do.”
What Is Plus–Delta?
Plus–Delta is a simple, two‑column reflection tool used to capture what worked well (“Plus”) and what should change (“Delta”).
It functions as a structured prompt for constructive feedback, emphasizing improvement without blame. The “Plus” column reinforces strengths and successful behaviors, while the “Delta” column highlights opportunities for adjustment (the symbol denotes change).
Continuous Improvement and Origins of Plus–Delta
The roots of Plus–Delta trace back to the continuous improvement community, where teams routinely used simple “what worked/what to improve” reflections during Kaizen events, quality circles, and PDCA cycles.
Although the exact phrase “Plus–Delta” was not yet standardized, the underlying pattern of reinforcing positives while identifying targeted changes was embedded in TQM and Lean practices throughout the 1980s and 1990s.
Facilitators in manufacturing, utilities, and service industries adopted the symbol as a natural shorthand for “change,” gradually shaping the two‑column format that would later be recognized as Plus–Delta. By the early 2000s, the method had become a common closing activity in facilitated continuous improvement workshops. However, it was not formally documented.
Plus–Delta is Published
Gamestorming is a structured, game‑based approach to creative thinking, problem‑solving, and innovationused in business, design, and facilitation. Plus-Delta became a staple of Gamestorming in the early 2000s, and the book formally published the method in 2010.
Today, most modern facilitation libraries trace their version of Plus–Delta to Gamestorming, even though many facilitators trace it to its continuous improvement lineage.
I first learned Plus-Delta in the early 2000s while facilitating operations improvement programs. It was a decade before I knew what Gamestorming officially was.
A Few Tips for Using Plus-Delta
These are a few high-level tips for evaluating your facilitated sessions at the end of the workshop.
Use the secondary facilitator or the executive sponsor to conduct the session.
Use one flipchart (or whiteboard) for the Plus and one for the Delta.
Remind everyone that “plus” is something you would like to see again, and a “delta” is something you would like to see less in the future. (Delta is something that needs to be changed, but not necessarily bad).
Don’t try to defend the deltas.
Provide the feedback to everyone later as part of the workshop summary.
Keep the exercise to 15 minutes or less.
Give each participant up to one plus and one delta – it’s fine to offer neither.
Why Plus-Delta Works
The Plus–Delta Feedback Method works because it is simple and time-effective. When used consistently, it helps technical professionals refine their facilitation approach and produce better decisions. The method is a small investment that delivers significant returns in clarity and performance.
Communicating Asset Risk with Context, Clarity, and FINESSE!
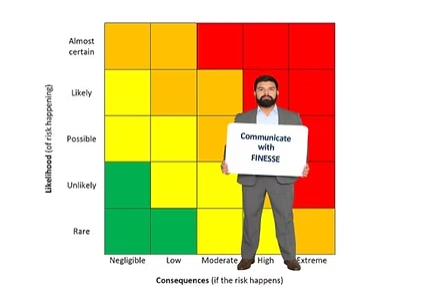
Heat maps have become the default visual for communicating asset risk. They appear simple. They appear objective. They appear to give leaders a clear picture of where to focus attention. The problem is that heat maps often distort the very information they are meant to clarify. They compress complex risk into a grid of colors that hides uncertainty, masks subjectivity, and creates a false sense of precision.
Heat maps based on risk matrices are no more than two-dimensional graphs. Graphs are merely simple ways to communicate data. The two-dimensional graph became common in the late 1700s in math and social sciences (related to geography and locating features of populations, like diseases). In social science contexts, grey was the color of choice to show areas of higher concentration in the early days. In the 1970s, color printers became more economical and the “heat map” was born. The heat map is used in a number of professions including engineering and meteorology (yes, to hate a “heat map” is to hate a modern weather map).
To hate a “heat map” is to hate a modern weather map.
Senior management needs a clear understanding of asset risk. They need to know where the organization is vulnerable, what the consequences could be, and what choices are available. Heat maps derived from a risk matrix are merely a starting point. Their usefulness as decision tools is simply for initial prioritization. Effectively communicating asset risk requires a more disciplined approach.
The Illusion of Precision
Heat maps derived from risk matrices give the impression that risk can be reduced to a single score. The scoring process commonly involves subjective judgments about likelihood and consequence. These judgments are influenced by experience, assumptions, and organizational culture.
The purpose of a two-dimensional graph, including a risk matrix. Graphs help us to explain data. That makes risk matrices good potential tools on the back-end to communicate findings and insights. They are a useful tool on the front-end to help brainstorm, develop common understanding, and provide insights. Do not mess up the nature of a risk matrix by attempting to make it something that it is not. The risk matrix is simply one tool in the risk toolbox.
The reality is that many risk scores are built on limited data. Asset condition assessments may be incomplete. Failure histories may be inconsistent. Consequence estimates may be based on outdated assumptions. When these uncertainties are hidden behind a color, leaders are not getting the full picture. They are getting a simplified version that may not support sound decisions.
The Problem of False Equivalence
Heat maps also create false equivalence. Two assets may appear in the same red box even though their risks are fundamentally different. One may have a high likelihood of failure with moderate consequences. The other may have a low likelihood of failure with severe consequences. The heat map treats them as equal. Senior management may assume they require the same level of attention or investment.
The risk matrix is not enough on its own. Good, maybe, if your organization is just starting its risk journey. Or helpful for building some common understanding. Or maybe good as part of a communication program. But risk matrices do not have sufficient power for anything other than the simplest problems.
This false equivalence can lead to misallocation of resources. It can also lead to confusion when technical professionals try to explain why two red boxes do not represent the same level of urgency. The visual simplicity becomes a barrier to understanding rather than a tool for clarity.
Establish the Context
Context Matters Most
Context is arguably the most important step in any risk or reliability assessment because it determines what questions are being asked, what information is relevant, and how the results will be used.
Without context, technically sound analyses can lead to poor decisions because they answer the wrong question.
In fact, both ISO 31000 (Risk Management) and ISO 55000 (Asset Management) specify ”establishing the context” at the beginning of their processes. The reason is simple: risk does not exist in isolation. Risk depends on objectives, stakeholders, operating conditions, constraints, and the consequences that matter to the organization.
Organizations perform asset condition assessments for many reasons, and those reasons should influence the scope, rigor, and frequency of the assessment. An organization may be evaluating a potential acquisition, establishing replacement asset value, developing a predictive maintenance program, or prioritizing capital investments may require very different data than an organization seeking only a general understanding of asset health.
That’s why grabbing a condition assessment score of ‘4’ and coloring it red on a heat map does not tell the entire story. In fact, it may be downright misleading, depending on the context and related approach of the condition assessment.
Systems Thinking
Reliability best practices begin at the system level by identifying the organization's objectives, critical services, and the assets that are most important to achieving them. This context guides which assets should receive the greatest attention during condition assessments and how the results should be interpreted. Ultimately, the value of a condition assessment is measured not by the condition of individual assets, but by how well it improves decisions about system reliability, risk, and investment.
What Leaders Actually Need
Senior management needs a clear understanding of the nature of the risk. They need to know what could happen, how likely it is, and what the consequences would be. They also need to understand the uncertainty in the analysis. They want to know where the data is strong and where it is weak.
A heat map cannot provide this level of insight. It can highlight areas of concern, but it cannot explain them. Business leaders need a narrative that connects the technical assessment to the operational and financial realities of the organization. A structure is needed that helps decision makers understand their choices when it comes to asset risk.
Better Ways to Communicate Asset Risk
One part of communicating asset risk effectively requires moving beyond the heat map. Scenario comparisons provide a clearer picture of how different failures would affect the organization. Risk curves show how risk changes over time and how interventions shift the trajectory. Options and impacts tables help leaders understand the consequences of different investment choices.
Are you performing a risk analysis or an uncertainty analysis?
Another aspect is to make risk understandable to everyone. Most professionals do not understand the difference between risk and uncertainty. And while everyone has a definition of risk, few people have the same definition. Operationalize risk, even if the common understanding is not as theoretically correct as you prefer.
A Formal Communication Approach Supports Better Decisions
Heat maps are not the problem. Overreliance on them and poorly communicating them are the problem. They are useful for insights, initial prioritization, and a communication tool when used properly. Heat maps need a communication approach that respects the complexity of asset risk while presenting it in a way that supports action.
The elements of the FINESSE fishbone diagram® are Frame, Illustrate, Noise reduction, Empathy, Structure, Synergy, and Ethics.
An example of communication to senior management is provided in the referenced article.
Communicating Asset Risk Beyond Heat Maps
We usually help business leaders make better decisions when we move beyond the heat map. With that said, heat maps based on a risk matrix are not the problem. Heat maps are just one tool in the risk toolbox and can be used effectively. The keys for understanding asset risk when using them is to apply the techniques correctly, not over-rely on them, and to use a formal communication approach.
The purpose of a condition assessment should determine how it is planned, executed, and used.
Ask ten engineers why they perform condition assessments, and you may receive ten different answers. Many will say they are simply assessing condition, as if all condition assessments are done for the same purpose. Some will say it is to identify failing assets. Others will point to preventive maintenance, capital planning, or regulatory compliance.
The reality is that organizations perform condition assessments for many different business reasons. Unfortunately, many assessments begin without a clearly defined objective. The result is often too much data and too little useful information related to the decision that needs to be made.
Ask a Simple Question
Ask one simple question before beginning any condition assessment.
What decision are we trying to improve?
The answer should guide the scope of work, the assessment methods, the data collected, and the resources invested.
Five Major Reasons For Doing Condition Assessments
I sat down with some of my leading asset managers a dozen years ago and we came up with a list of twenty reasons we did condition assessments. We consolidated the list into five super-categories based on how the reason for the condition assessment impacts the technical scope.
Category 1: Building Knowledge About Your Assets
Every condition assessment begins with understanding the assets themselves. Before an organization can optimize maintenance or prioritize capital investments, it must first understand what it owns and the condition of those assets.
1. Understand What You Own
An asset inventory identifies the assets an organization owns. A condition assessment describes their physical condition and operational health. Together, they provide the foundation for effective asset management.
Organizations often perform an initial assessment to document current conditions. This baseline allows future assessments to measure deterioration, improvements, and changes resulting from maintenance or rehabilitation.
3. Estimate Remaining Useful Life
Two assets installed on the same day may have very different remaining service lives because of operating conditions, maintenance history, loading, or environmental exposure. Condition assessments provide more reliable estimates than age alone.
4. Monitor Deterioration Over Time
Repeating assessments at appropriate intervals helps organizations understand deterioration rates and anticipate future maintenance and replacement needs before failures occur.
Scope: The scope for these four reasons can take the form of visual walk-downs and table-top exercises. The outcome is usually a 1 to 5 or 1 to 10 condition score for each asset.
Category 2: Improving Maintenance and Reliability
Maintenance programs are most effective when they are based on the actual condition of assets rather than assumptions or calendar schedules.
5. Prioritize Corrective Maintenance
Condition assessments identify assets requiring immediate repairs before problems become more serious, more disruptive, or more expensive.
6. Improve Preventive Maintenance Programs
Assessment results often reveal opportunities to adjust preventive maintenance frequencies, procedures, or inspection intervals based on observed asset performance.
Predictive maintenance relies on measurable indicators such as vibration, infrared thermography, oil analysis, ultrasonic testing, electrical testing, or corrosion monitoring. Condition assessments help identify which technologies provide the greatest value.
8. Improve System Reliability
Organizations seeking higher reliability use condition information to reduce unexpected failures, improve equipment availability, and minimize service interruptions.
Scope: The scope includes the visual walkdowns and table-top exercises, but also requires more invasive testing, such as thermography, vibration monitoring, oil analysis, and other methods requiring field measurements.
Category 3: Supporting Risk and Capital Planning
One of the greatest values of condition assessments is improving investment decisions.
9. Support Risk Assessments
Condition is a primary input for estimating an asset’s likelihood of failure. When combined with the consequences of failure, organizations can prioritize assets using a risk-based framework.
10. Prioritize Capital Improvement Projects
Condition assessments help distinguish assets that are simply old from those that present unacceptable business risks. This results in more objective capital investment decisions.
11. Optimize Lifecycle Costs
Replacing assets too early wastes capital. Waiting too long increases emergency repairs, operational disruptions, and customer impacts. Condition assessments help determine the most economical point for rehabilitation or replacement.
12. Justify Capital Budget Requests
Objective condition information strengthens business cases presented to executive management, governing boards, regulators, and funding agencies.
Scope: The scope includes visual walk-downs, table-top exercises, and field measurement, plus a strong influence from risk models and capital project lists. The scope can be more targeted for what the organization has prioritized, rather than simply “shot-gunning” all assets.
Category 4: Supporting Financial and Business Decisions
Condition assessments are valuable tools for financial planning as well as engineering.
13. Improve Long-Range Capital Planning
Reliable condition data improve Capital Improvement Programs by providing realistic projections of future infrastructure needs.
Many organizations use condition assessments to refine estimates of Replacement Asset Value (RAV), helping them better understand the scale of future investment requirements and funding gaps.
15. Support Financial Reporting
Condition information supports reserve studies, depreciation analyses, long-term financial planning, and broader discussions about infrastructure sustainability.
16. Support Property Transactions and Insurance
Condition assessments are frequently performed during property purchases, utility acquisitions, mergers, insurance evaluations, financing activities, and due diligence reviews. Understanding the condition of physical assets reduces uncertainty for buyers, sellers, lenders, insurers, and investors.
Scope: The end game becomes the financial value of the asset and not a 1 to 5 or 1 to 10 score. That puts higher focus on performance measures and their conversion into reductions in asset value.
Some of the greatest benefits of condition assessments occur at the organizational level rather than within maintenance or engineering departments.
17. Support Regulatory Compliance
Certain industries require periodic inspections or documented condition assessments to demonstrate compliance with permits, regulations, industry standards, or consent agreements.
Understanding vulnerable assets helps organizations prepare for hurricanes, floods, earthquakes, cyber incidents, and other disruptive events that threaten critical infrastructure.
19. Measure the Effectiveness of Maintenance Investments
Repeating condition assessments allows organizations to evaluate whether maintenance programs, rehabilitation projects, or operational improvements are producing measurable results.
20. Improve Executive Decision Making
Ultimately, the greatest value of a condition assessment is reducing uncertainty.
Executives rarely approve projects simply because infrastructure is old. They make better decisions when they understand the asset’s condition, the likelihood and consequences of failure, the remaining useful life, the financial implications of delaying action, and the risks associated with different investment options.
Scope: The scope in these cases is targeted at the decision at hand, and the approach and techniques are highly variable to the decision (allocation of resources) that needs to be made.
Reasons for Performing Condition Assessments
Condition assessments support asset management, maintenance planning, improved reliability, financial management, capital investment decisions, and organizational risk. Most importantly, condition assessments provide decision makers with objective information that helps them allocate limited resources more effectively.
Before beginning your next condition assessment, resist the temptation to start with inspection forms, testing equipment, or data collection software. Instead, start with a much simpler question: What decision are we trying to improve? When that question is answered first, the scope of the assessment becomes clearer, the data collected becomes more valuable, and the results are far more likely to be helpful.
Need help getting started? JD Solomon Inc. specializes in asset management systems, condition assessments, criticality evaluations, risk management, and reliability improvements—bringing clarity to what you own, its condition, and its value.